
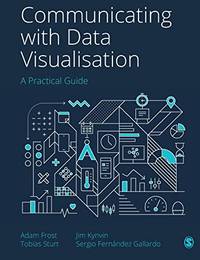

Communicating with Data Visualisation: A Practical Guide Paperback - 2022
by Adam Frost
- Used
- very good
- Paperback
A$10.06
A$16.59
Delivery to USA
Standard delivery: 7 to 40 days
More delivery options
Standard delivery: 7 to 40 days
Ships from World of Books Ltd (West Sussex, United Kingdom)
Details
- Title Communicating with Data Visualisation: A Practical Guide
- Author Adam Frost
- Binding Paperback
- Condition Used - Very good
- Pages 368
- Volumes 1
- Language ENG
- Publisher Sage Publications Ltd
- Publication date 2022-03-01
- Features Annotated, Bibliography, Index, Maps
- Bookseller's Inventory # GOR012536138
- ISBN 9781529743777 / 152974377X
- Weight 1.95 lbs (0.88 kg)
- Dimensions 9.69 x 7.44 x 1 in (24.61 x 18.90 x 2.54 cm)
- Category Computers - Data Base Management
- Library of Congress subjects Information visualization, Communication - Data processing
- Library of Congress Catalogue Number 2021936953
- Quantity available 1
About World of Books Ltd West Sussex, United Kingdom
Biblio member since 2007
In 2002, World of Books was founded on an ethos to do good, protect the planet, and support charities by enabling more goods to be reused. Since then, we've grown into a global pioneer, dedicated to helping people read more and waste less. Through the World of Books brand, customers can now buy and sell with us! We provide affordable, preloved books to book lovers all around the world, while also giving people the opportunity to contribute to the circular economy, earn money and protect the planet by trading in their unwanted books and media for cash. Through the B2B side of our business we've developed technology to help charities sell in bulk, meaning they can clear much needed floor space and make money for great causes at the same time. A new book will be sold once but their stories can be enjoyed by more than one owner. After all, a story doesn't change because it's been read before!
If you are not completely satisfied with your purchase for any reason, simply email customerservice@worldofbooks.com and we will quickly resolve any issues you may have. If you have any other queries about your order, please email customerservice@worldofbooks.com. Our goal is to deliver to our customers the best possible service and we hope your experience of dealing with us lives up to our promise. If for whatever reason we fail to meet your expectations then please let us know.
Reader reviews for Communicating with Data Visualisation: A Practical Guide
Write a review for this book
Important Terms and Guidelines
- Please focus on the book’s content and context. Also, add any personal comments as to how you enjoyed the book. Substantiate your likes and dislikes. You may make comparisons to other books.
- Reviews must be at least 140 characters in length.
- Please do not reveal critical plot elements.
- This is not a help line. Contact customer support if you need help.
Your review must not include:
- Obscenities, discriminatory language, or other insulting language not suitable for public domain
- Advertisements, “spam” content, or references to other products, offers or websites.
- Email addresses, URLs, phone numbers, physical addresses or other contact information.
- Overly critical comments about other reviews or reviewers
- Time-sensitive material (i.e. promotional tours, seminars, lectures, etc.)
- Availability, price, or alternative ordering/shipping information

