
Stock photo: cover may vary
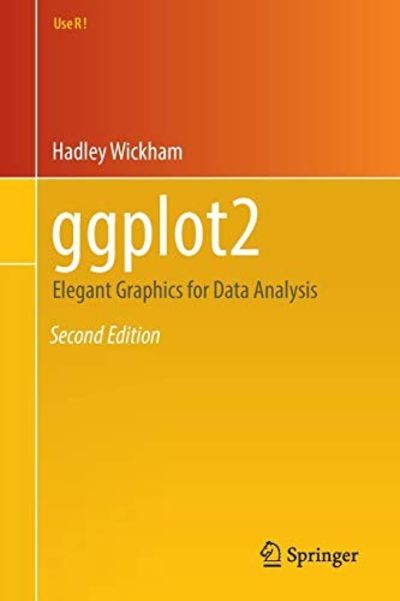
ggplot2: Elegant Graphics for Data Analysis (Use R) Paperback - 2016
by Wickham, Hadley
- Used
A$20.01
A$5.78
Delivery within USA
Standard delivery: 5 to 9 days
More delivery options
Standard delivery: 5 to 9 days
Ships from Wonder Book (Maryland, United States)
Details
- Title ggplot2: Elegant Graphics for Data Analysis (Use R)
- Author Wickham, Hadley
- Binding Paperback
- Edition 2nd
- Condition Used - Very good
- Pages 260
- Volumes 1
- Language ENG
- Publisher Springer
- Publication date 2016-06-16
- Illustrated Yes
- Features Illustrated, Maps
- Bookseller's Inventory # K12R-00094
- ISBN 9783319242750 / 331924275X
- Weight 0.87 lbs (0.39 kg)
- Dimensions 9.21 x 6.14 x 0.58 in (23.39 x 15.60 x 1.47 cm)
- Category Computers - Other Applications
- Dewey Decimal Code 004
About Wonder Book Maryland, United States
Biblio member since 2003


With 3 stores less than 1 hour outside the DC/Metropolitan area (1 in Gaithersburg, 1 in Frederick and 1 in Hagerstown, MD), we have the largest selection of books in the tri-state area. Wonder Book and Video has been in business since 1980 and online since 1997. We have over 1 Million books for sale on our website and another 1 Million books for sale in our 3 locations. We have a very active online inventory and as such, we can receive multiple orders for the same item. We fill those orders on a first come first serve basis, but will refund promptly any items that are out of stock. Since 1980 it has always been about the books. ALL kinds of books from 95 cent children\'s paperbacks to five figure rare and collectibles. A merging of the old and new is where we started, and it is where we are today. Our retail stores have always been places where a reader can rush in looking for a title needed for a term paper that is due the next day, or where bibliophiles can get lost \"in the stacks\" for as long as they wish. In 2002 USAToday recognized us as \"1 of 10 Great Old Bookstores\", and we have been featured in numerous other newspaper and TV stories including Washington Post and CSpan.
RETURNS are cheerfully accepted up to 30 days. We ship out within 1-2 business days and U.S. Standard Shipments usually arrive within 6-9 business days, Priority 3-6.
Reader reviews for ggplot2: Elegant Graphics for Data Analysis (Use R)
Write a review for this book
Important Terms and Guidelines
- Please focus on the book’s content and context. Also, add any personal comments as to how you enjoyed the book. Substantiate your likes and dislikes. You may make comparisons to other books.
- Reviews must be at least 140 characters in length.
- Please do not reveal critical plot elements.
- This is not a help line. Contact customer support if you need help.
Your review must not include:
- Obscenities, discriminatory language, or other insulting language not suitable for public domain
- Advertisements, “spam” content, or references to other products, offers or websites.
- Email addresses, URLs, phone numbers, physical addresses or other contact information.
- Overly critical comments about other reviews or reviewers
- Time-sensitive material (i.e. promotional tours, seminars, lectures, etc.)
- Availability, price, or alternative ordering/shipping information
From the publisher
From the rear cover
This new edition to the classic book by ggplot2 creator Hadley Wickham highlights compatibility with knitr and RStudio. ggplot2 is a data visualization package for R that helps users create data graphics, including those that are multi-layered, with ease. With ggplot2, it's easy to:
- produce handsome, publication-quality plots with automatic legends created from the plot specification
- superimpose multiple layers (points, lines, maps, tiles, box plots) from different data sources with automatically adjusted common scales
- add customizable smoothers that use powerful modeling capabilities of R, such as loess, linear models, generalized additive models, and robust regression
- save any ggplot2 plot (or part thereof) for later modification or reuse
- create custom themes that capture in-house or journal style requirements and that can easily be appliedto multiple plots
- approach a graph from a visual perspective, thinking about how each component of the data is represented on the final plot
This book will be useful to everyone who has struggled with displaying data in an informative and attractive way. Some basic knowledge of R is necessary (e.g., importing data into R). ggplot2 is a mini-language specifically tailored for producing graphics, and you'll learn everything you need in the book. After reading this book you'll be able to produce graphics customized precisely for your problems, and you'll find it easy to get graphics out of your head and on to the screen or page. New to this edition:
- Brings the book up-to-date with ggplot2 1.0, including major updates to the theme system
- New scales, stats and geoms added throughout
- Additional practice exercises
- A revisedintroduction that focuses on ggplot() instead of qplot()
- Updated chapters on data and modeling using tidyr, dplyr and broom
- produce handsome, publication-quality plots with automatic legends created from the plot specification
- superimpose multiple layers (points, lines, maps, tiles, box plots) from different data sources with automatically adjusted common scales
- add customizable smoothers that use powerful modeling capabilities of R, such as loess, linear models, generalized additive models, and robust regression
- save any ggplot2 plot (or part thereof) for later modification or reuse
- create custom themes that capture in-house or journal style requirements and that can easily be appliedto multiple plots
- approach a graph from a visual perspective, thinking about how each component of the data is represented on the final plot
This book will be useful to everyone who has struggled with displaying data in an informative and attractive way. Some basic knowledge of R is necessary (e.g., importing data into R). ggplot2 is a mini-language specifically tailored for producing graphics, and you'll learn everything you need in the book. After reading this book you'll be able to produce graphics customized precisely for your problems, and you'll find it easy to get graphics out of your head and on to the screen or page. New to this edition:
- Brings the book up-to-date with ggplot2 1.0, including major updates to the theme system
- New scales, stats and geoms added throughout
- Additional practice exercises
- A revisedintroduction that focuses on ggplot() instead of qplot()
- Updated chapters on data and modeling using tidyr, dplyr and broom

