BIBLIO is the largest independent book marketplace in the world, with over 100 million books.

Skip to content

Statistical Graphics for Visualizing Multivariate Data

Statistical Graphics for Visualizing Multivariate Data

Statistical Graphics for Visualizing Multivariate Data
Stock photo: cover may vary

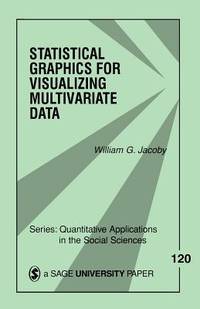
Statistical Graphics for Visualizing Multivariate Data Paperback - 1998 - 1st Edition

by Jacoby, William G

Add to wish list
  • Used
Used - Good

Description

SAGE Publications, Incorporated. Used - Good. Pages intact with minimal writing/highlighting. The binding may be loose and creased. Dust jackets/supplements are not included. Stock photo provided. Product includes identifying sticker. Better World Books: Buy Books. Do Good.
Ask the seller a question Add to wish list
A$26.39
Free Delivery within USA
Standard delivery: 4 to 8 days
More delivery options
Ships from Better World Books (Indiana, United States)

Details

  • Title Statistical Graphics for Visualizing Multivariate Data
  • Author Jacoby, William G
  • Binding Paperback
  • Edition number 1st
  • Edition 1
  • Condition Used - Good
  • Pages 112
  • Volumes 1
  • Language ENG
  • Publisher SAGE Publications, Incorporated
  • Publication date 1998-02-06
  • Illustrated Yes
  • Features Bibliography, Illustrated, Table of Contents
  • Bookseller's Inventory # 5729407-75
  • ISBN 9780761908999 / 0761908994
  • Weight 0.3 lbs (0.14 kg)
  • Dimensions 7.98 x 6 x 0.27 in (20.27 x 15.24 x 0.69 cm)
  • Category Medical / Nursing
  • Library of Congress subjects Multivariate analysis - Graphical methods
  • Library of Congress Catalogue Number 97045244
  • Dewey Decimal Code 001.422
  • Quantity available 2

About Better World Books Indiana, United States

Biblio member since 2005

Better World Books is a for-profit, socially conscious business and a global online bookseller that collects and sells new and used books online, matching each purchase with a book donation. Each sale generates funds for literacy and education initiatives in the U.S., the UK, and around the world. Since its launch in 2003, Better World Books has raised over $35 million for libraries and literacy, donated over 38 million books, and reused or recycled more than 475 million books.

Terms of Sale: Better World Books ("BWB") values your satisfaction and offers you returns within thirty (30) days after the estimated delivery date on most items. All returned items must be in the original condition; used items should include the SKU sticker located on the spine or back of the product. If you have an incomplete, incorrect, or damaged shipment, please contact our Customer Care team via Biblio's contact seller options before proceeding with the return. Please keep in mind that because we deal mostly in used books, any extra components, such as CDs, DVDs, figurines, or access codes are not included.

Browse books from Better World Books

Reader reviews for Statistical Graphics for Visualizing Multivariate Data

From the publisher

Author William G. Jacoby explores a variety of graphical displays that are useful for visualizing multivariate data. The basic problem involves representing information that varies along several dimensions when the display medium (a computer screen or printed page) is inherently two-dimensional. In order to address this problem, Jacoby introduces the concepts of a "data space." He then explains several methods for coding information directly into the plotting symbols used to represent the observations. He next describes pictorial representations of three-dimensional space followed by a discussion of the scatterplot matrix as a way of "flattening out" the multiple dimensions of a multivariate data space. In addition, he examines conditioning plots (which are strategies for "looking into subregions" of the multidimensional data space), and presents the biplot as a technique for showing observations and variables together in a single display. He concludes with a discussion of some general ideas about data visualization. Statistical Graphics for Visualizing Multivariate Data will enable researchers to better explore the contents of a dataset, find the structure in their data, check the underlying assumptions of the statistical model they used, and better communicate the results of their analysis.

About the author

William G. Jacoby is a Professor in the Department of Political Science at Michigan State University. He is also a Research Scientist at the University of Michigan, where he serves as Director of the Inter-University Consortium for Political and Social Research (ICPSR) Summer Training Program in Quantitative Methods of Social Research.
Professor Jacoby joined the MSU faculty in 2003. Previously, he held positions at the University of South Carolina, Ohio State University, and the University of Missouri. He received his Ph.D. from the University of North Carolina, Chapel Hill in 1983.
Professor Jacoby′s main professional interests are mass political behavior (public opinion, political attitudes, voting behavior) and quantitative methodology (measurement theory, scaling methods, statistical graphics, modern regression). His current research focuses on citizen ideology and belief system organization, value choices and their implications for subsequent political orientations, measuring policy priorities in the American states, the implications of measurement assumptions for statistical models, and graphical strategies for data analysis.
Recently, Professor Jacoby has taught courses on public opinion, regression analysis, scaling methods, and statistical graphics.

tracking-